

![[Section Divider Image]](https://substackcdn.com/image/fetch/$s_!bzSx!,f_auto,q_auto:good,fl_progressive:steep/https%3A%2F%2Fsubstack-post-media.s3.amazonaws.com%2Fpublic%2Fimages%2Fe18757c6-93c9-44b6-aac7-563e23acf369_1456x75.png "[Section Divider Image]")
For most of this year there has been one relationship that mattered more than any other for the gold price, and I have walked you through it week after week. Oil goes up. Inflation expectations go up with it. Treasury yields follow. And gold, which pays you nothing to hold it, gets sold to buy something that does.
That machine has been running cleanly since the conflict with Iran began. This week it stopped.
Since hostilities resumed and the memorandum of understanding was scrapped, oil has punched violently higher, the Strait of Hormuz has closed again, and the 10-year Treasury yield has climbed to a new high for this move. Every one of those inputs says gold should be making fresh lows.
Gold is not making fresh lows. It is grinding higher.
A single week is not a trend, and I am not going to tell you the correction is over when I cannot know that yet. But when an asset stops responding to the thing that has been beating it up, that is usually not noise. That is sentiment changing underneath the price, before the price shows you.
Here is the one piece of evidence that convinced me, and I will give it to you in full.
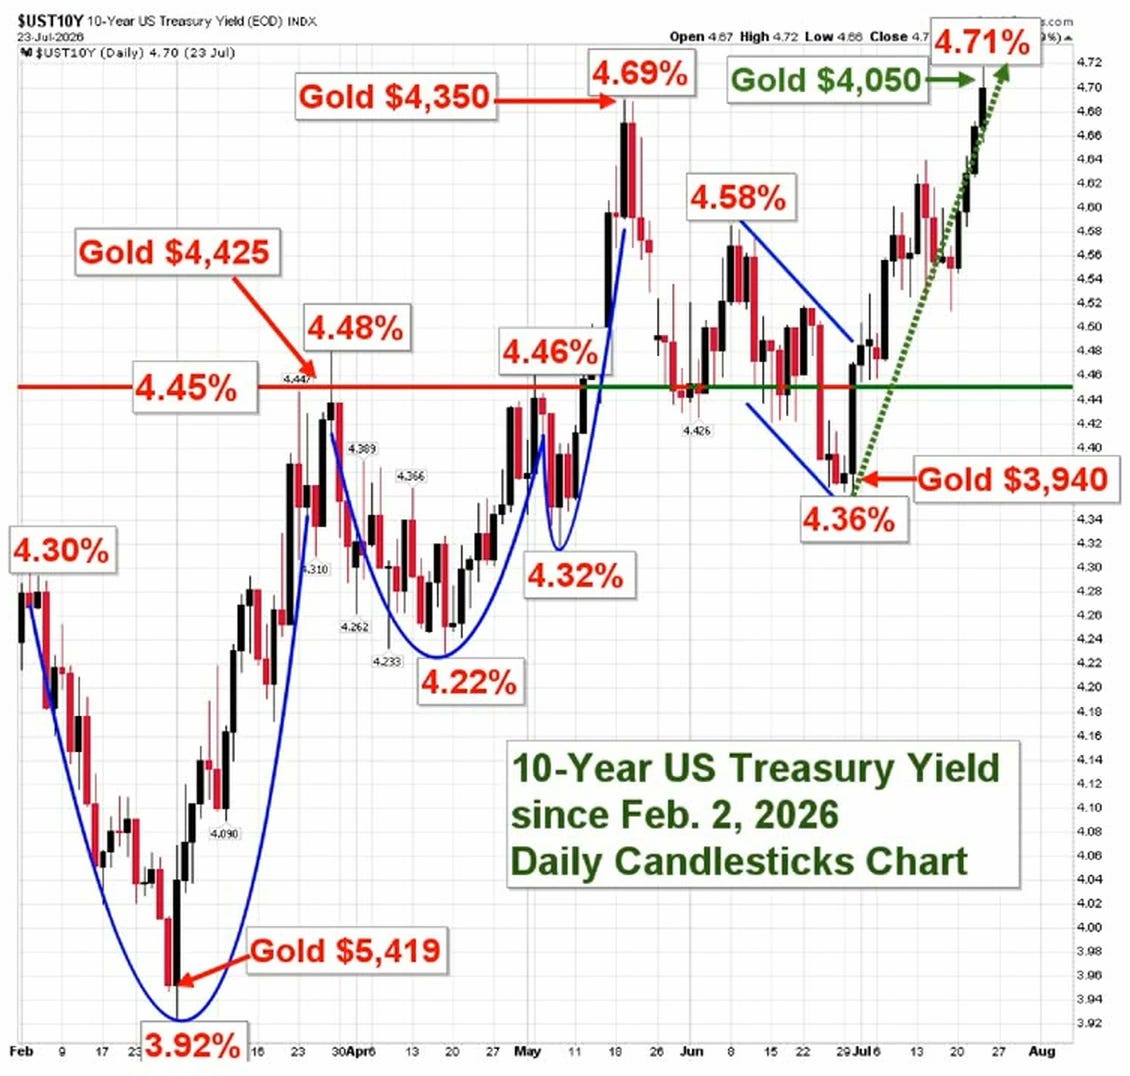
Two weeks ago the 10-year Treasury yield sat at 4.36%, and gold was at $3,940. As I write, the 10-year has pushed up to 4.71%, a new high for this cycle, and gold is at $4,050. Yields up sharply. Gold up with them. Compare that to mid-February, before any of this started, when the 10-year was at 3.92% and gold was around $5,400. The inverse relationship was intact then. It is not intact now.
That is the break. A market that refuses to fall on its own bad news is a market where someone is quietly accumulating on the other side.
So the question I am spending my time on now is not what happened. It is what happens next. Specifically: who is doing the buying, whether the bid is strong enough to hold if oil makes another run at the highs, exactly where my support and resistance levels sit for gold going into August, and which of the four precious metals I think offers the best value at today’s prices. My answer on that last one may surprise you, because it is not gold and it is not silver.
If you have not done so already, join us behind the paywall and let me show you what I think happens from here.


