

Two weeks ago I told you gold would probably have to slip a little under $4,000, and silver into the $55 to $58 range, before it attracted serious buying. That is exactly what happened. Gold bottomed at $3,955 and silver at $55.75, and both have turned higher since. As I write this on Friday afternoon, gold is back around $4,170 and silver is trading near $62.30. Gold is up roughly $200 from its June 30 low. Silver is up almost $8 from its June 23 low.
So the bounce is here. The only question that matters when a market turns up off a low is whether you can trust it. Is this a real bottom, with buyers stepping in to build a floor under the market, or just a relief rally inside a downtrend that has not finished punishing people yet? I have a firm view on that, and it is not the view most people are trading on right now. It comes down to two things: exactly who did the buying this week, and one price level on the gold chart that almost nobody is watching. The buying tells you whether the bounce is real. That one level tells you whether it holds, or whether the real bottom still sits a few hundred dollars below where we closed today. Get both right and you will know whether to treat this move as the bottom to buy or a trap to wait out.
Let me give you the first piece right now, because it sets up everything else. The very first leg up off the lows was not U.S. buying at all. It came out of Asia, in the middle of the night here in the States, bargain hunters stepping in the moment gold slipped under $4,000 and silver hit the mid $50s. That matters more than it sounds, because who buys first tells you whether a rebound has a real foundation or is just short covering that fades by lunch. Asia buying the dip is a foundation. And it was only the start of the pattern.
That pattern, and where it points gold and silver from here, is the whole picture I want to walk you through today, piece by piece, with the charts that show it. If you have not done so already, subscribe and let me show you what I think happens next.


Where the Buying Came From: East and West Together
Every leg of this rebound lines up with a specific source of demand on the intraday charts, and the sequence is exactly what these markets have needed. We already saw the first one. Now watch how the rest of the week built on it.
The next leg up was New York buying, after Fed Chair Kevin Warsh spoke in Europe and signaled that inflation expectations had eased a bit, which took the pressure off. So we had Asian buying off the dip, then U.S. buyers following through on top of it. East and West both participating. That is the signature of a move that can actually hold, rather than one side buying while the other quietly sells into the rally.
The third push for gold came on Thursday, when the June jobs report showed just 57,000 new jobs, well short of what the market expected, with the prior two months revised down a combined 74,000 on top of that. A soft labor market tells the Fed it may not need to keep tightening, and gold caught a bid on it. So across those four moves higher, two came from Asia and two came from the U.S. That broad based buying is the first thing I needed to see, and it passed.
But broad based buying only tells you the bounce is real. It does not tell you the bounce will hold. For that I have to look at two more things this week is quietly telling us, and this is where my read splits from the crowd. The first is what the dollar and Treasury yields did while metals were rising. The second is that single level on the longer term gold chart. Let me take them in order, because together they are what decide whether this is a bottom to buy or a trap to sit out.
The Dollar, Yields, and Why Metals Held
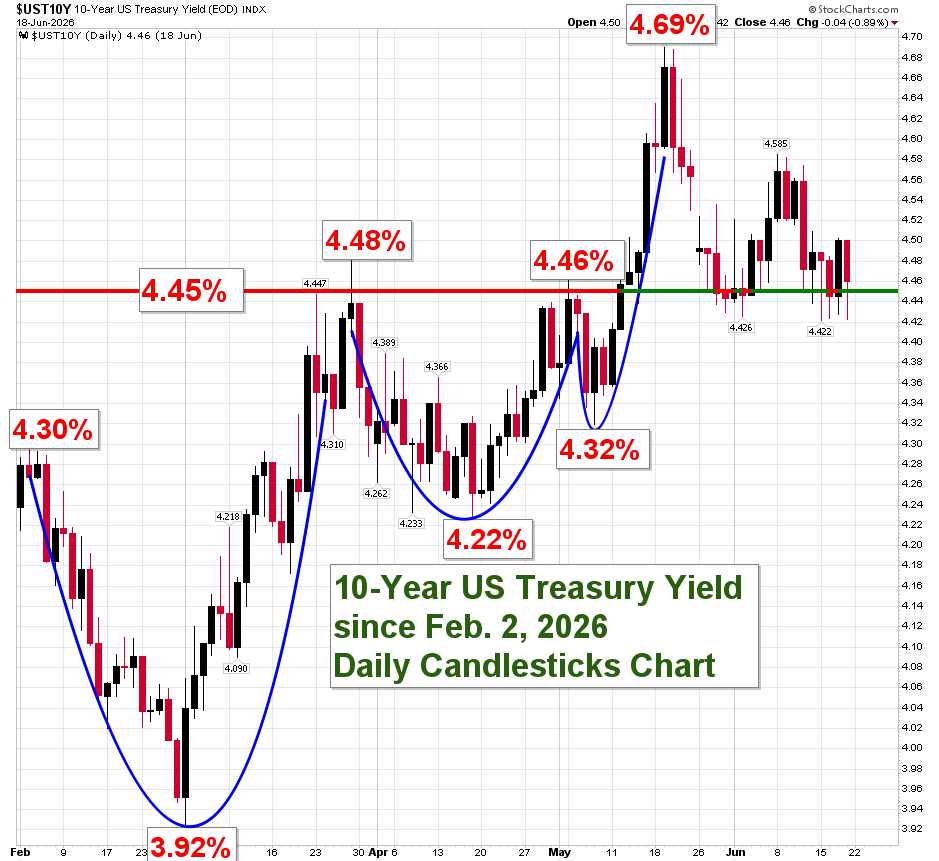
Here is the thing that almost never happens on a fake rally, and it is what convinces me this rebound has real support underneath it. Precious metals tend to trade inversely to Treasury yields and the dollar. So when yields and the dollar firm up, gold and silver usually get pressured. This past week we got the opposite of what you would expect, and it is worth understanding exactly why it matters.
The 10-year Treasury yield actually puffed up a little over the last couple of sessions. Normally that is a headwind for metals, and on a weak bounce it is exactly the kind of pressure that rolls prices back over. But gold and silver rose anyway. When metals climb into a rising yield instead of buckling under it, that is real buyers absorbing everything the market throws at them. That is the tell. It says the demand this week is genuine, not just a mechanical snapback that fades the moment conditions turn.
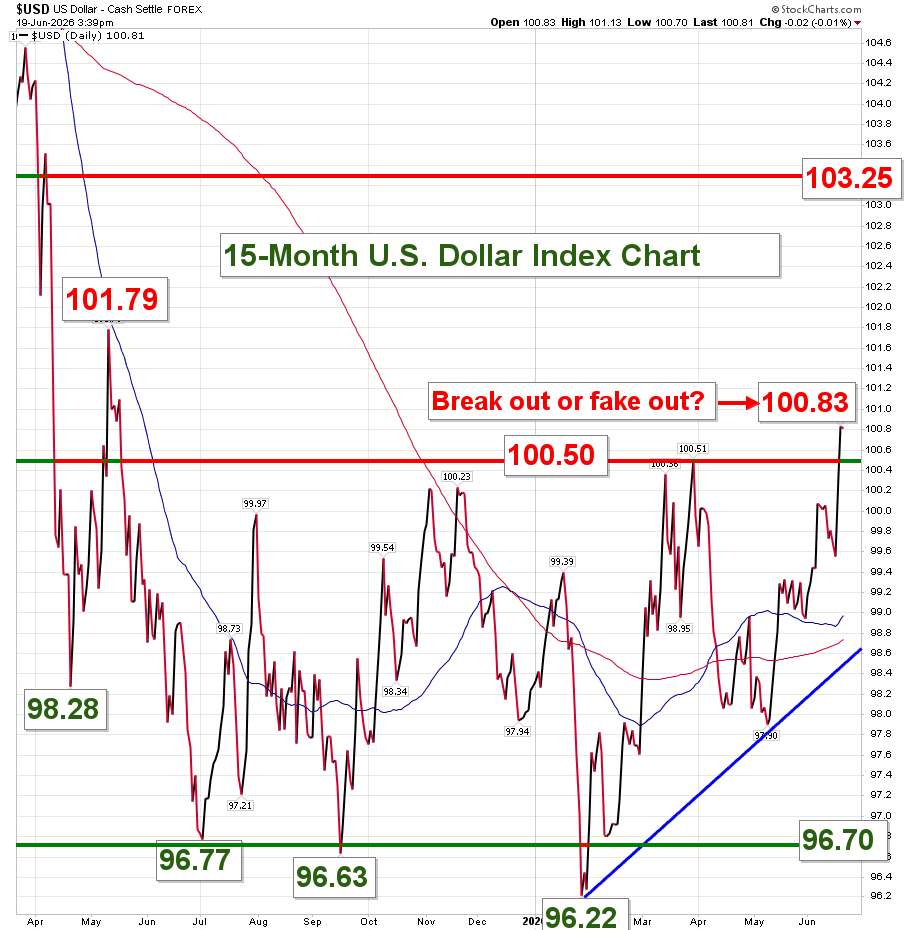
The dollar tells the same story from the other side. A week ago the dollar had pushed higher and looked like it might break out, which would have pressured metals lower. I called that move a breakout or a fake out at the time, because I was not convinced it was the real thing. Sure enough, the dollar has since come back off that peak, and it is now on track for its largest weekly decline since April. With Warsh signaling that inflation is easing, and the dollar softening rather than breaking out, both of the usual headwinds for metals eased at the same moment the buying showed up. That is a good alignment for gold and silver right now.
The Bigger Picture: Support, Resistance, and Backfilling
Now let me pull the lens back, because the two week bounce is only half the story. What matters more is how today’s action fits the trends we have been in for the last two years, and there is a wrinkle here I want you to see clearly.
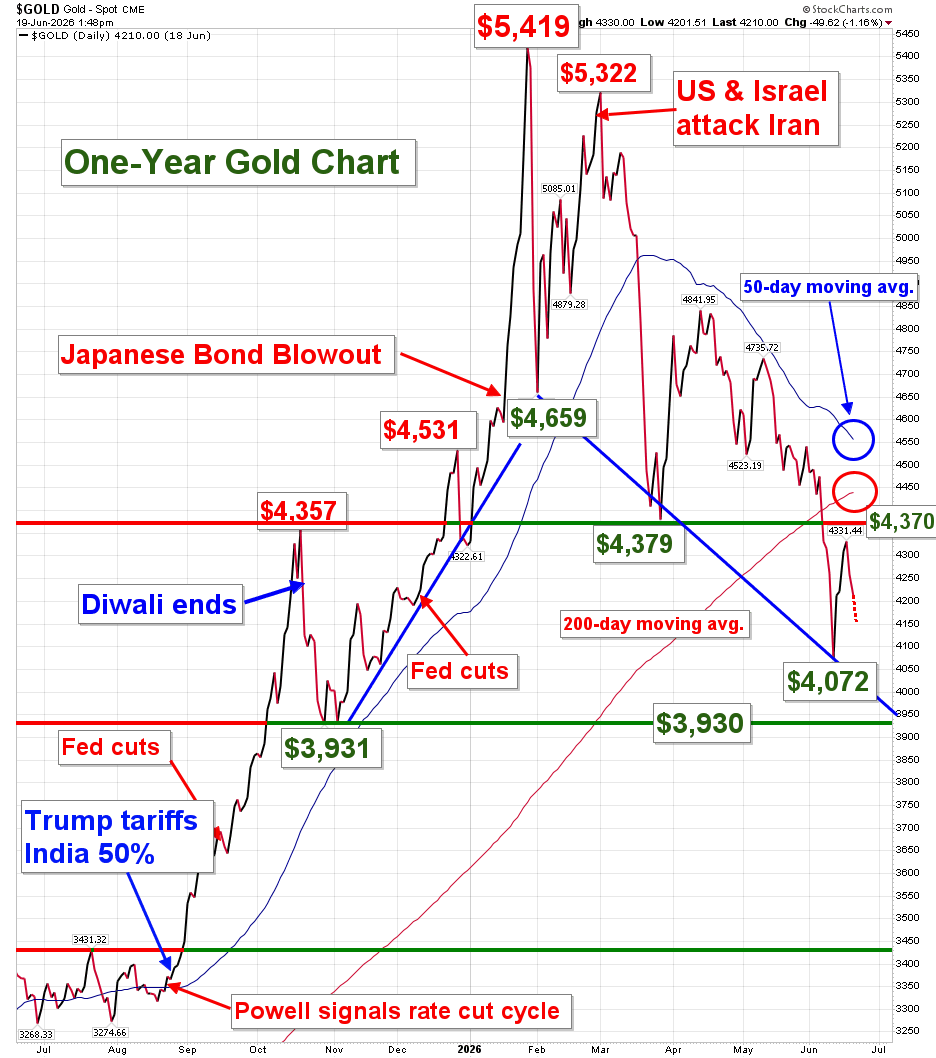
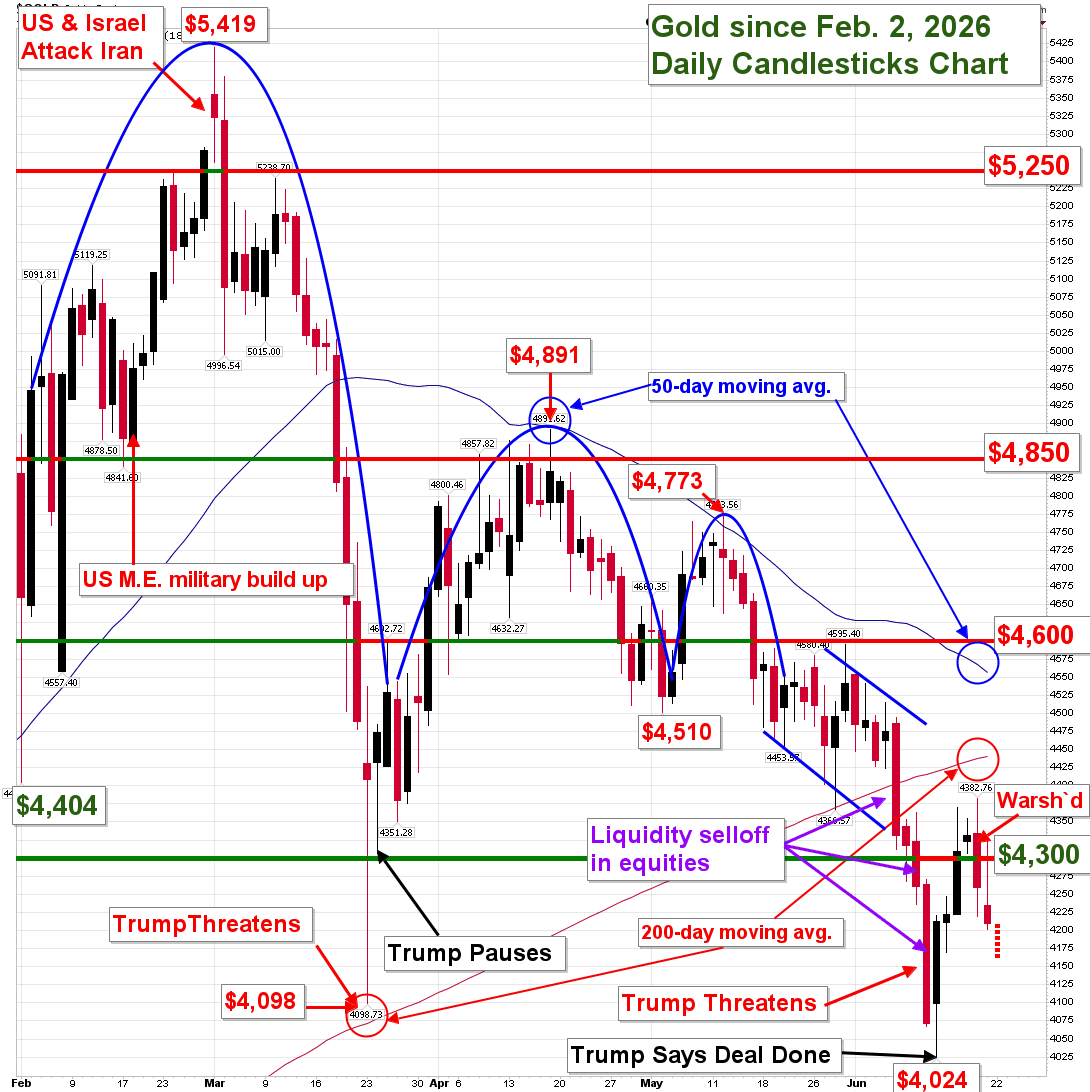
Gold has been riding a rising trend line all the way back to the start of 2024. That is a two and a half year trend, and gold is still just north of it, which is constructive. Here is the number I am watching, and the one I think almost nobody else is: $3,930. That is the next real support level below where we are trading. Lose it, and the chart under it turns ugly in a hurry, because the drop from $3,930 down to $3,400 is a long stretch with almost nothing to catch a falling price in between. That gap is what concerns me.
When a market runs through a zone quickly on the way up, it often comes back later to backfill that range with the trading it skipped on the way through. Gold did exactly that twice on the way up. The move from $3,400 to $3,930 was sharp, with little trading, and so was the move from $4,350 up to $4,840 before the peak at $5,419. The difference is that the upper zone, between $4,350 and $4,840, has already been backfilled on the way down. The lower one, between $3,400 and $3,930, has not. So if gold breaks under $3,930, and I am not saying it will, that open space is exactly where an ultimate bottom for this consolidation could still form, a few hundred dollars below where we closed today. That is why this bounce, real as the buying is, is not yet something I would call a confirmed bottom. One number decides it.
Why Silver May Be the Healthier of the Two
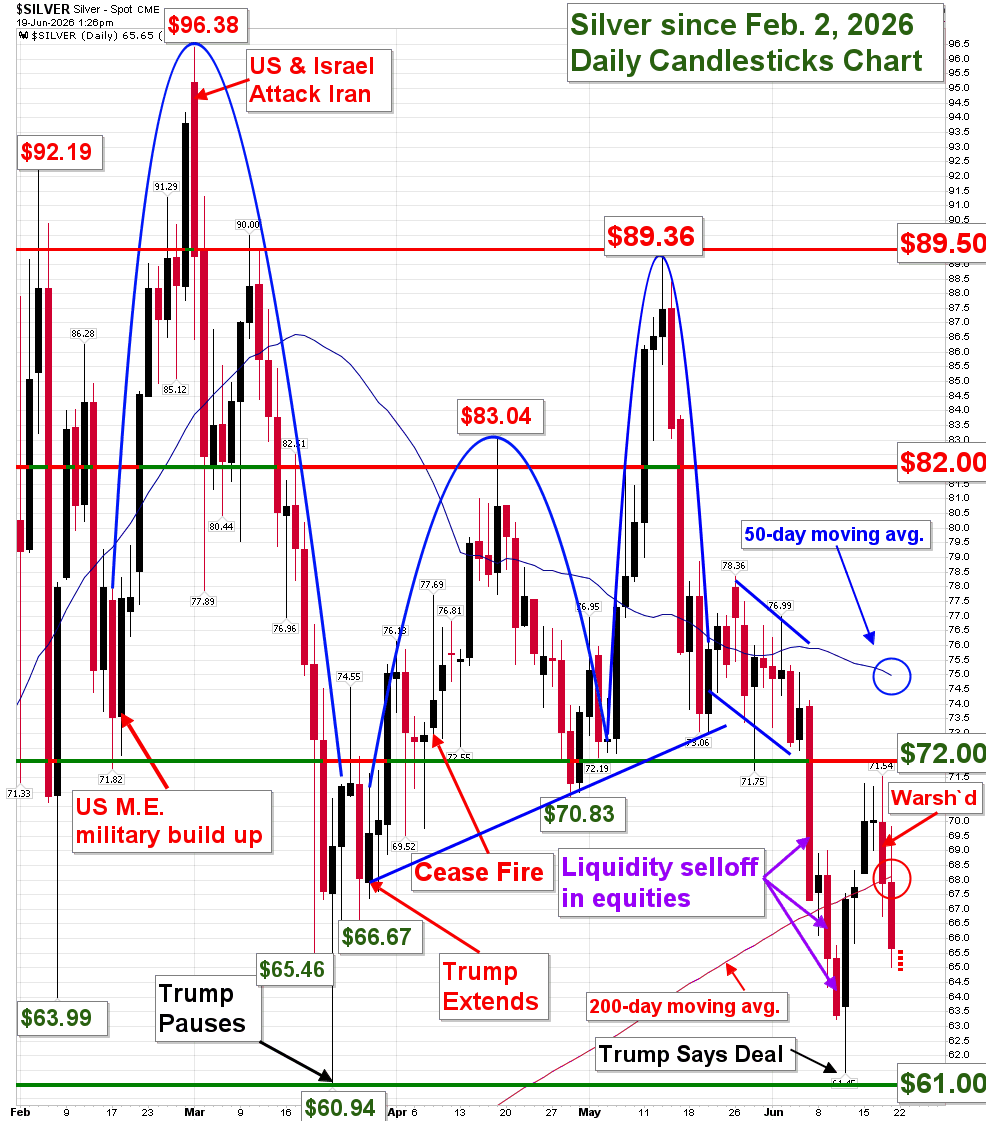
Silver gives us a similar map with a more encouraging read. It ran sharply from $54.20 up toward $70.50 and then spiked higher still, all the way to a peak around $116.58, before pulling back. On the way down it has already backfilled the zone from $70.50 up into the $94 area, and right now it is working through that lower band between $54.20 and $70.50. In other words, silver is doing its backfilling in real time, right here, rather than leaving an open gap hanging below it the way gold has.
The gold to silver ratio has climbed to about 66.9 to one, which tells me gold is playing a little catch up to silver as this rebound has developed. Put it together and silver looks to me like the healthier of the two metals in the current environment, and riper for rebounds higher, based on how it is respecting these longer term levels. We may not be completely out of the woods on firm bottoms for either metal, but I like what silver is showing me here.
What I Am Watching From Here
A few things stay on my radar. The Iran situation is still unresolved, and energy prices remain the swing factor. Right now oil has eased as flows through the Strait of Hormuz recover, which takes some of the inflation pressure off and helps metals. But that can turn quickly, and a real disruption there would change the calculus fast. I would also point out that Europe and Asia are more exposed to higher energy costs than we are, which is part of why global stocks have been a little tentative, and part of why these metal prices softened in the first place. It is a global economy, and those inputs matter.
What I keep coming back to is the quality of this rebound. Buying from both the East and the West, metals rising even as yields firmed, and the dollar backing off a move I never trusted. Central banks are still in the market too, having added to reserves in May. That is a broad base of demand, and a broad base is what turns a bounce into a bottom. Summer tends to be quieter for metals, so we may still see some chop before this fully resolves. But it is encouraging to see real buyers show up at these levels rather than sellers pressing an advantage.
If we can help you put physical gold or silver to work in your own holdings, that is exactly what we do. For clients looking at value right now, the vintage U.S. gold coin side of the market is where I see the most room, with pieces like the MS64 $20 Saint-Gaudens trading close to bullion premiums while carrying real premium expansion upside over their long term average. It is a way to own gold with a second lever working for you. This is our 28th year doing this, and we would be honored to help. Whatever you decide, watch the levels, trust the broad based buying, and good luck out there.
Dana Samuelson President, American Gold Exchange


