


Gold did not fall this spring because the bull market broke. It fell for a reason most investors have completely missed, and once you see it, the entire move makes sense. There has been a lot of noise and a lot of fog in these markets since the Strait of Hormuz closed, and that fog is exactly why so many people are drawing the wrong conclusion right now.
What I have found is a single, specific driver that has moved gold, silver, platinum, and palladium more directly than anything else since early February. It is not the dollar. It is not the Fed funds rate. It is something quieter, and it runs on a chain that starts at the Strait of Hormuz and ends at the price on your screen. Let me show you the whole chain, link by link, so you can anticipate how this plays out over the next several months.
Why the Strait of Hormuz closure started it all
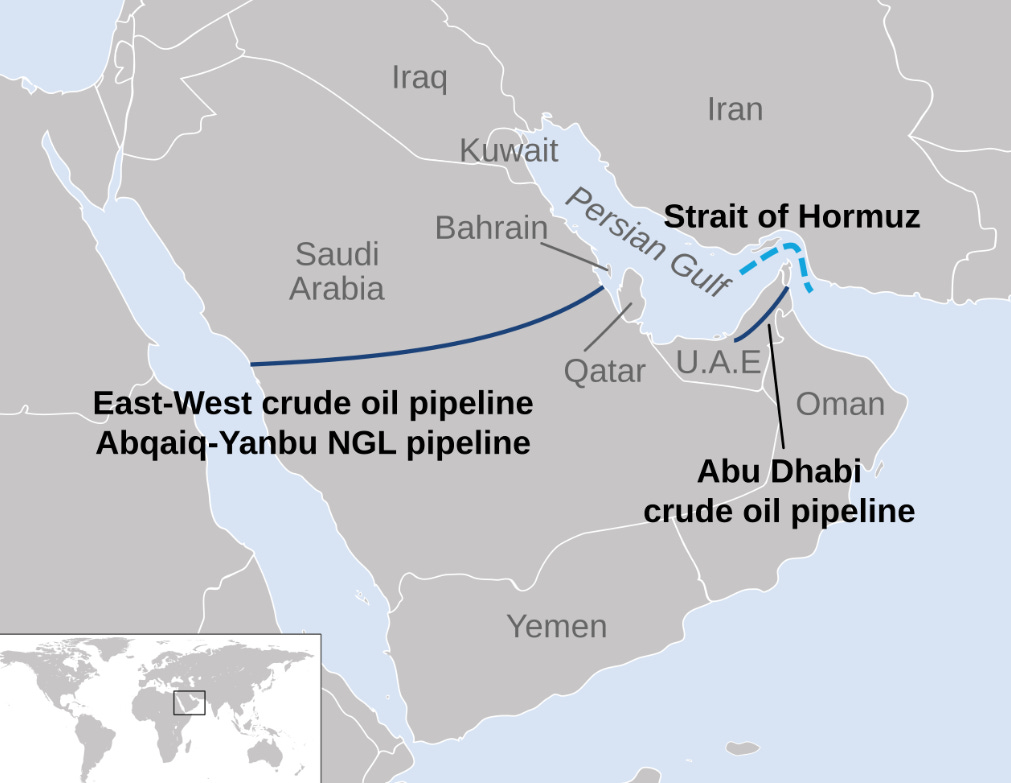
It has now been roughly two months since the conflict with Iran began and the Strait of Hormuz was effectively closed, creating the largest oil supply disruption in history. The war has settled into a stalemate, with Iran blocking the strait from the inside and the United States blocking Iran’s oil exports from the outside. The head of the International Energy Agency testified in Paris this week that we now face the biggest energy crisis in history.
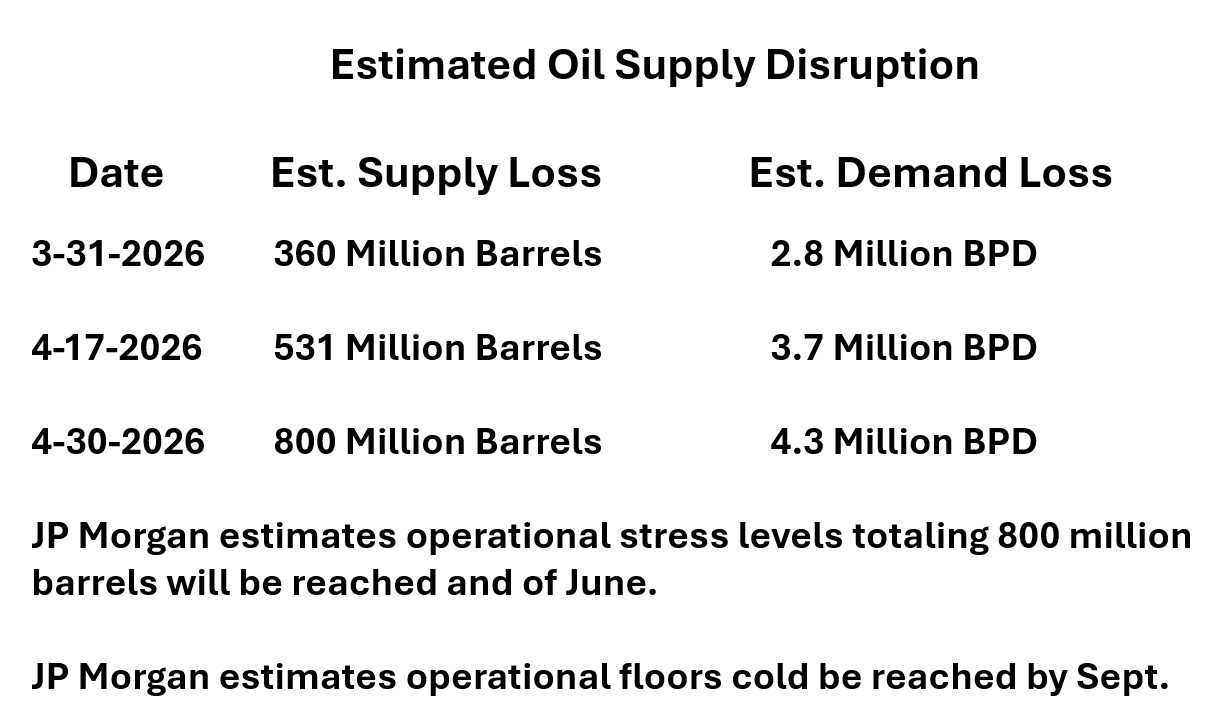
The scale of the disruption is sobering, and it has been getting worse with each update. There was a cushion of oil in storage when this began, about 8.4 billion barrels, but only roughly 800 million barrels of that is truly material as a shock absorber. JPMorgan now estimates the cumulative supply loss has reached 800 million barrels, up from 531 million two weeks ago and 360 million at the end of March. The one factor buying the world time is that higher prices have triggered demand destruction, with lost demand climbing from 2.8 million barrels a day a month ago to 4.3 million a day now. That softening is stretching the supply cushion, but JPMorgan expects it to reach a breaking point by June if the strait stays closed.
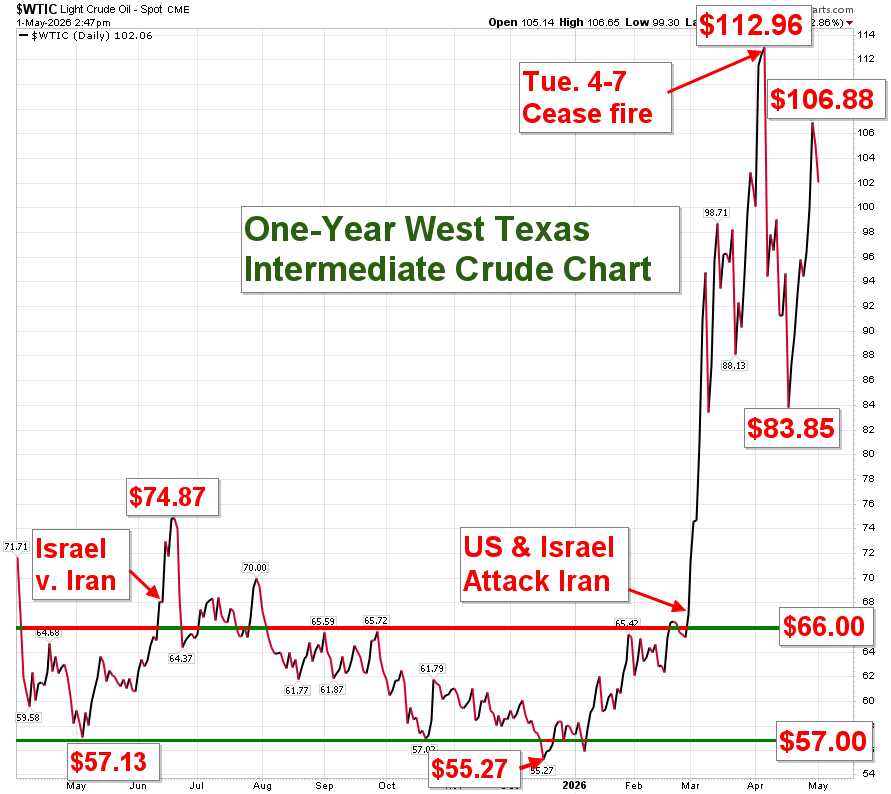
You can see the result in the oil price itself. Brent crude was trading between $60 and $72.50 before the conflict. It punched up to $112.57 at the peak, eased to $90.38 when a ceasefire was briefly declared, and as the stalemate dragged on it ran right back toward the highs, closing near $106. West Texas Intermediate followed the same path, trading $57 to $66 before the war, peaking at $112.96, bottoming at $83.85, and running back above $100. That is oil higher for longer, and that is where the chain of cause and effect begins.
So oil is higher for longer. That part is easy to see. The hard part, the part almost everyone is getting wrong, is what oil is doing to one specific number, and what that number is doing to gold. I can show it to you in a single chart that lines the two up side by side, and once you see it you will not be able to unsee it. Here is exactly how the chain works, and what it is telling me to do next.
How oil moves Treasury yields, and yields move gold
Here is the transmission, step by step, because this is the part most people miss. Higher oil prices feed directly into inflation expectations. When bond investors anticipate more inflation, they sell bonds, and selling pushes yields up. Why hold a bond paying 4% when newer bonds pay 4.4%? Your older, lower-yielding bond is suddenly worth less. So as oil surged, eased, and surged again, the 10-year Treasury yield tracked it almost step for step. It started the war near 3.95%, punched up to 4.4% on the first oil run, eased to 4.22% as oil softened, then pushed back to 4.4% as oil rose again. Note that the benchmark here is the 10-year, not the federal funds rate, which has held steady at 3.64%.
Now connect that to gold. Gold pays no yield. So when Treasury yields rise, the opportunity cost of holding gold rises with them, and gold becomes less attractive. The result is an almost perfect inverse mirror image. The clearest way I can show you this is to take the 10-year yield, invert it, and set it beside the gold chart. The two move together, almost perfectly, on a daily basis.
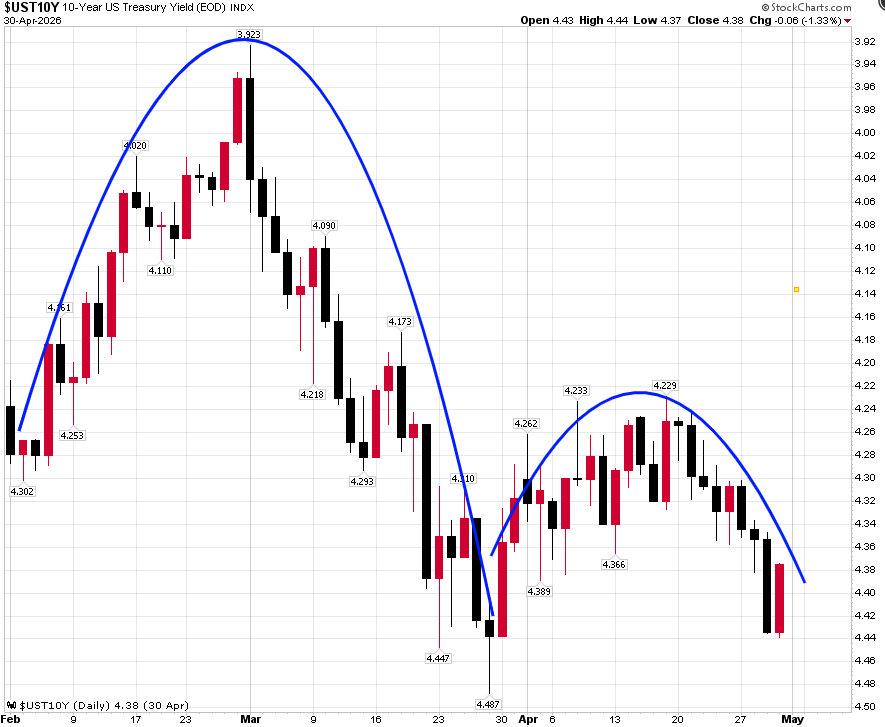
There used to be a reliable inverse correlation between gold and the dollar as well, but that link has broken down over the past couple of weeks. Right now, yields are the dominant driver, full stop. That is why I keep my eye on the 10-year above almost everything else when I read these markets.
Gold support and resistance levels to watch
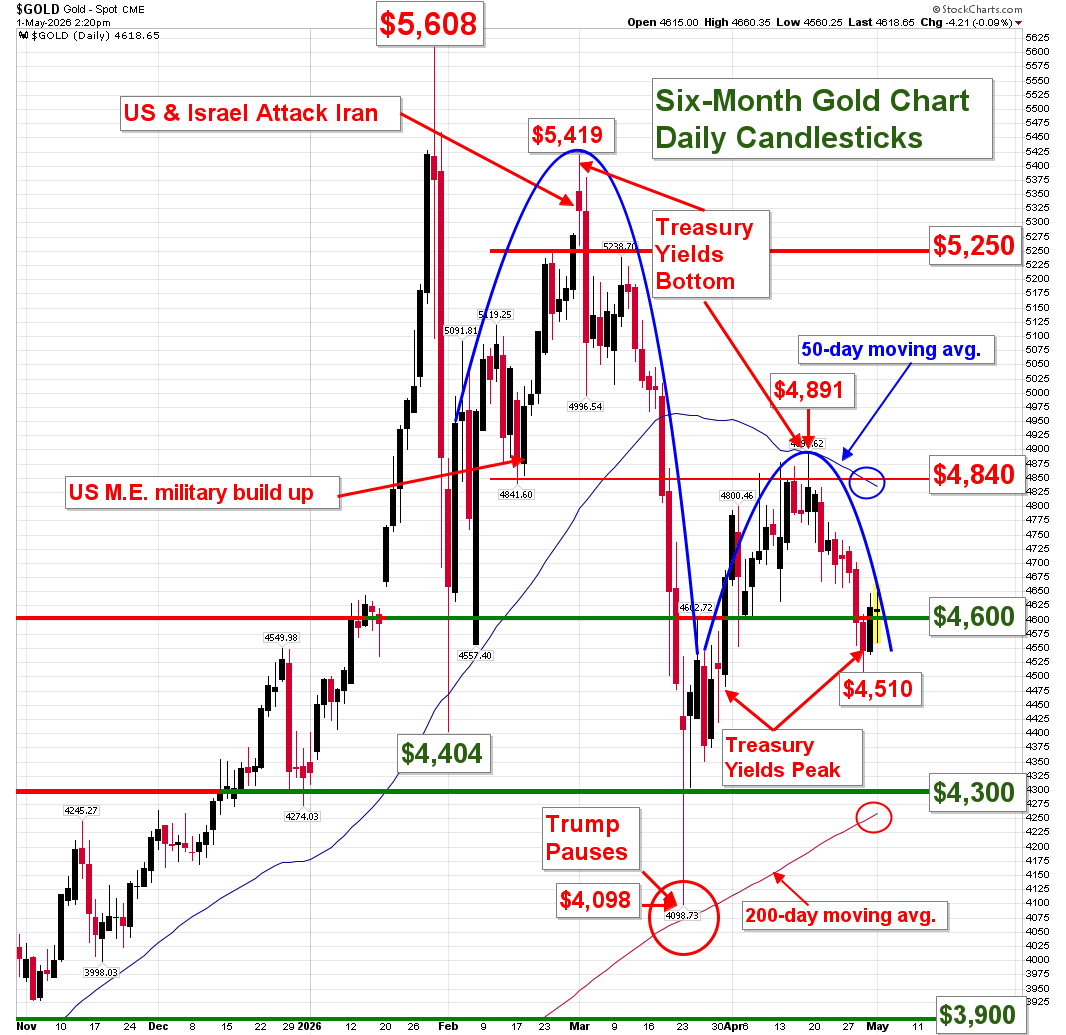
Let me give you the levels I am watching, because the moving averages have become very material here. When gold took its big tumble just before President Trump paused the military action, that selloff carried gold down to $4,098, which touched the 200-day moving average at the time. That average has since risen to just under $4,300, where I see major support now. On the upside, when gold surged back as yields fell, it brushed right up against the 50-day moving average before the rally stalled at $4,891. The 50-day now sits a little lower, near $4,835. With gold closing the week at $4,620, we are right about at the equilibrium point between those two levels.
Silver support and resistance to watch
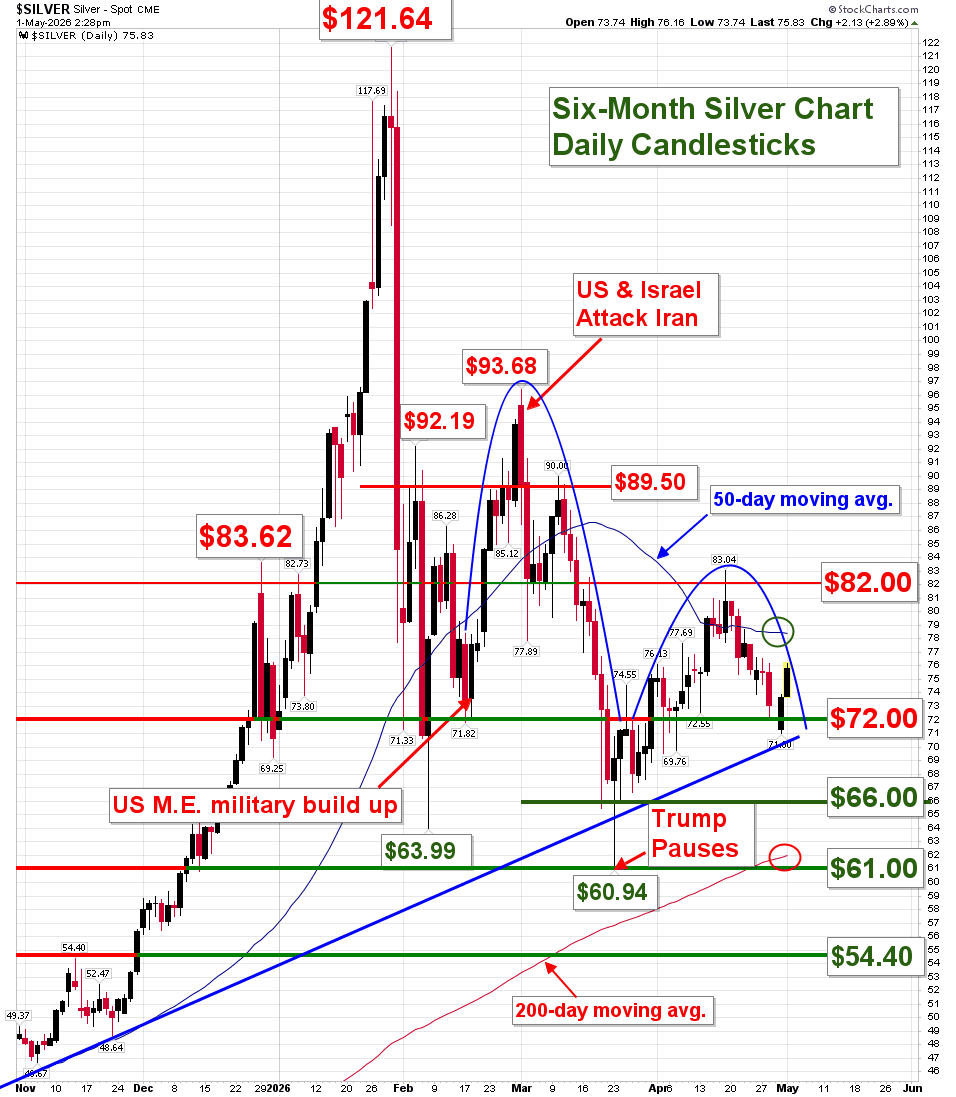
Silver tells the same story. It tumbled to $60.94 just before Trump paused the military action, so $61 is the bottom-line support, which is also right about where the 200-day moving average sits at $62. The 50-day moving average is the upper resistance. We got over it briefly two weeks ago, but as yields rose the metal slipped back, and the 50-day now sits at $78.40. So I see resistance at $78.40, then again at $82. There is also a rising trend line going all the way back to before silver went turbocharged last fall, and that line puts support today right around $71. With silver closing at $75.75, equilibrium is about $72, with the bias toward support at $66 and major support at $61.
Platinum and palladium are tracing the same two descending parabolas. Platinum has support near $1,800, with its 200-day average just above at $1,810 and resistance at the 50-day near $2,065. Palladium has firm support at $1,375, its 200-day near $1,485, and resistance around $1,585 to $1,615. The throughline for all four metals is the same: their inverse correlation to Treasury yields is the dominant driver right now.
Why the gold-to-silver ratio says buy both
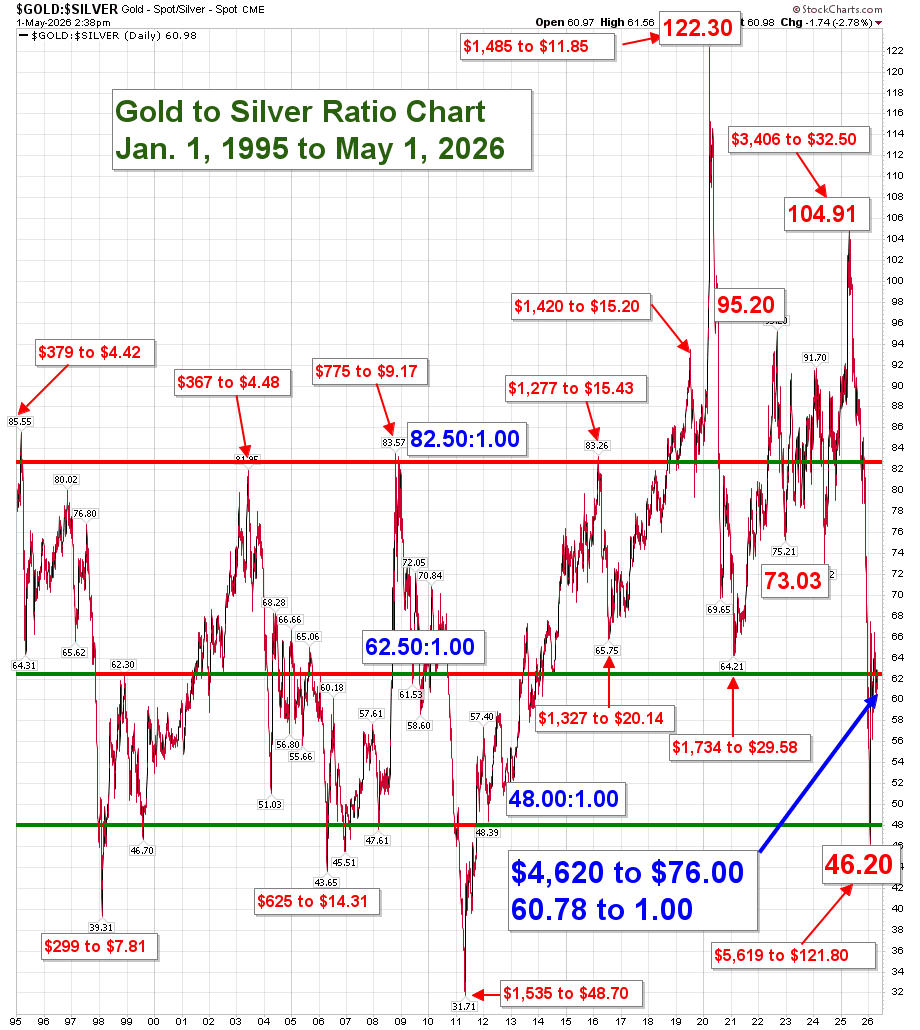
One simple tool I use to decide between the two main metals is the gold-to-silver ratio. With gold at $4,620 and silver at $76, the ratio sits at 60.78 to one, just below the 25-year equilibrium near 62.5 to one. That tells me gold and silver are close to fair value relative to each other. So if you are looking to invest, equal parts of both makes sense at these levels.
Why inflation and the Fed keep oil in the driver’s seat
Inflation is gaining momentum, which is no surprise given what oil has done. The Fed’s preferred gauge, the PCE price index, surged in the latest reading, with headline PCE up 70 basis points from 2.8% to 3.5%. I think the headline number works closer to 5% than not before this is over. Inflation is going to be higher for longer, right alongside oil.
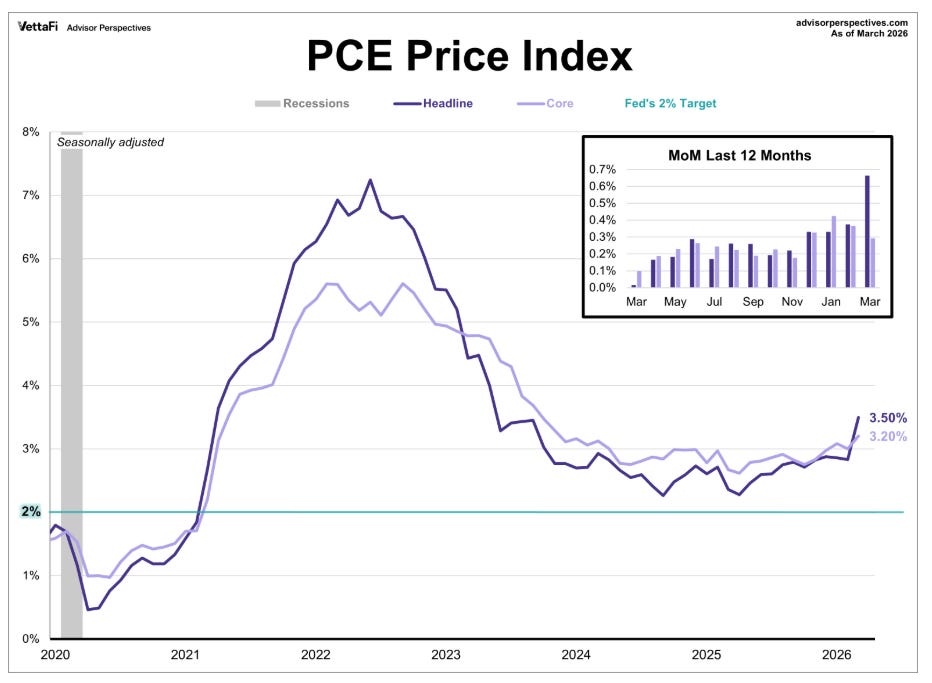
Here is why the Fed cannot easily fix this. The central bank normally raises the federal funds rate to create demand destruction and cool the economy. But the surging oil price is already doing that job all on its own. Raising rates would have virtually no effect on whether the Strait of Hormuz is open or closed, which is the real driver of oil supply and therefore of this entire inflation pulse. In my view, the Fed is largely neutered here. The funds rate held steady at this week’s meeting, and with a changing of the guard from Jerome Powell to Kevin Warsh coming at the top of the Fed, and political pressure to keep rates lower rather than higher, I expect the funds rate to hold and probably move lower over time. Lower rates down the road would eventually be a tailwind for gold, but that is a story for later this year, not today.
What I think happens next for precious metals
Let me speculate a little, based on what has already happened. Even if the Strait of Hormuz reopened tomorrow, we would see a knee-jerk selloff, but the fundamental 800 million barrel supply deficit has not yet hit world market pricing. I think that keeps oil higher for longer, which keeps yields elevated, which keeps pressure on precious metals over the next couple of months. The 10-year has now peaked near 4.4% twice. If it pushes toward 5%, that would pressure gold and silver to fresh near-term bottoms, possibly around $4,450 on gold and $65 to $66 on silver.
There is also a real chance kinetic military action against Iran restarts to force a resolution, which could spike oil again and run the same chain right back through yields into metals. So I would not be surprised by one more modest leg down. But here is how I am positioning my thinking. Summer tends to be quieter and a bit more vulnerable for precious metals, and by the fall there could be meaningful tailwinds building. So I am treating any new dip in gold and silver as a major buying opportunity, not a reason to step away.
If you want to put this into practice, one value play stands out to me right now. We have backdated one-ounce US Gold Eagles and MS64 $20 Saint-Gaudens double eagles trading at the same premium as bullion Gold Eagles. That is unusual. These vintage coins carry meaningful premium-expansion potential, on the order of 15 to 20% above their 10-year average premium, which gives you upside that bullion alone does not. At today’s levels, I think that is a genuinely good value for the right buyer.
This is our 28th year in business at American Gold Exchange, and I want to thank our loyal clients for the trust you have placed in us. Without you, we would not have a business, and we are grateful for it every day we are open. If we can help with any of your physical precious metals needs, buying or selling, we would be honored to have that opportunity.
Good luck out there.


