

![[Section Divider Image]](https://substackcdn.com/image/fetch/$s_!ffKi!,f_auto,q_auto:good,fl_progressive:steep/https%3A%2F%2Fsubstack-post-media.s3.amazonaws.com%2Fpublic%2Fimages%2F9a503075-7f51-4681-887f-0a7206e7072e_1456x75.png "[Section Divider Image]")
For most of this year, the thing moving gold and silver was the fog of war. Every headline out of Iran sent the metals lurching, and the last week and a half was no exception. President Trump ramped up the rhetoric, we struck Iran, and gold took a hard tumble all the way to $4,024 an ounce before it bounced. Then the Memorandum of Understanding got signed, the metals rallied, and on Wednesday the first FOMC meeting under new Fed chair Kevin Warsh washed them right back out again.
So here we sit today, June 19, with gold at $4,155 an ounce and the war dust finally starting to settle. And that is exactly why this update matters more than the last several. Because when the geopolitical noise fades, the real drivers step back into the light. I can see one of them taking over right now, and I do not think most people watching the metals have clocked it yet.
Here is the one thing I want you to take away before we go further, because it is the tell that separates a passing dip from a trend you have to respect. For the past year the dollar failed, over and over, to break above one line on the chart. This week, on the back of the Warsh Fed, it finally punched through. That single break is the difference between metals drifting sideways through the summer and metals grinding lower. Whether it holds is the question I am watching most closely.
And it was only the start of the pattern.
If you have not done so already, join us behind the paywall and let me walk you through exactly where the support and resistance levels sit on all four metals right now, what the new dominant driver is, and where I think gold and silver head through the summer months.
Why gold and silver eased lower into the Iran deal
Let me start with what actually happened, because the price action tells a clean story once you strip the war noise out of it.
Gold has been setting a pattern of lower highs, and this past week it carved out a new major lower low. The mechanism was the same one we saw back in March when the President first threatened Iran with overwhelming force. Rhetoric ramped up, kinetic action looked likely, and stocks sold off. Gold sold off right alongside them in a liquidity event, the kind of dash-to-cash where investors sell what they can, not what they want to. That took gold down to $4,024, part of a broader correction off the January highs. As soon as the action stopped and the deal was signed, we got the bounce, up to about $4,382 intraday.
Then Wednesday happened. The Warsh Fed held rates at 3-1/2 to 3-3/4 percent, but the projections underneath the decision leaned distinctly hawkish, with the committee signaling it may be moving toward a rate-hiking cycle rather than the cuts the market had penciled in. Metals sold off on the news, and we came back down through Thursday and eased a touch lower overnight in Asia.
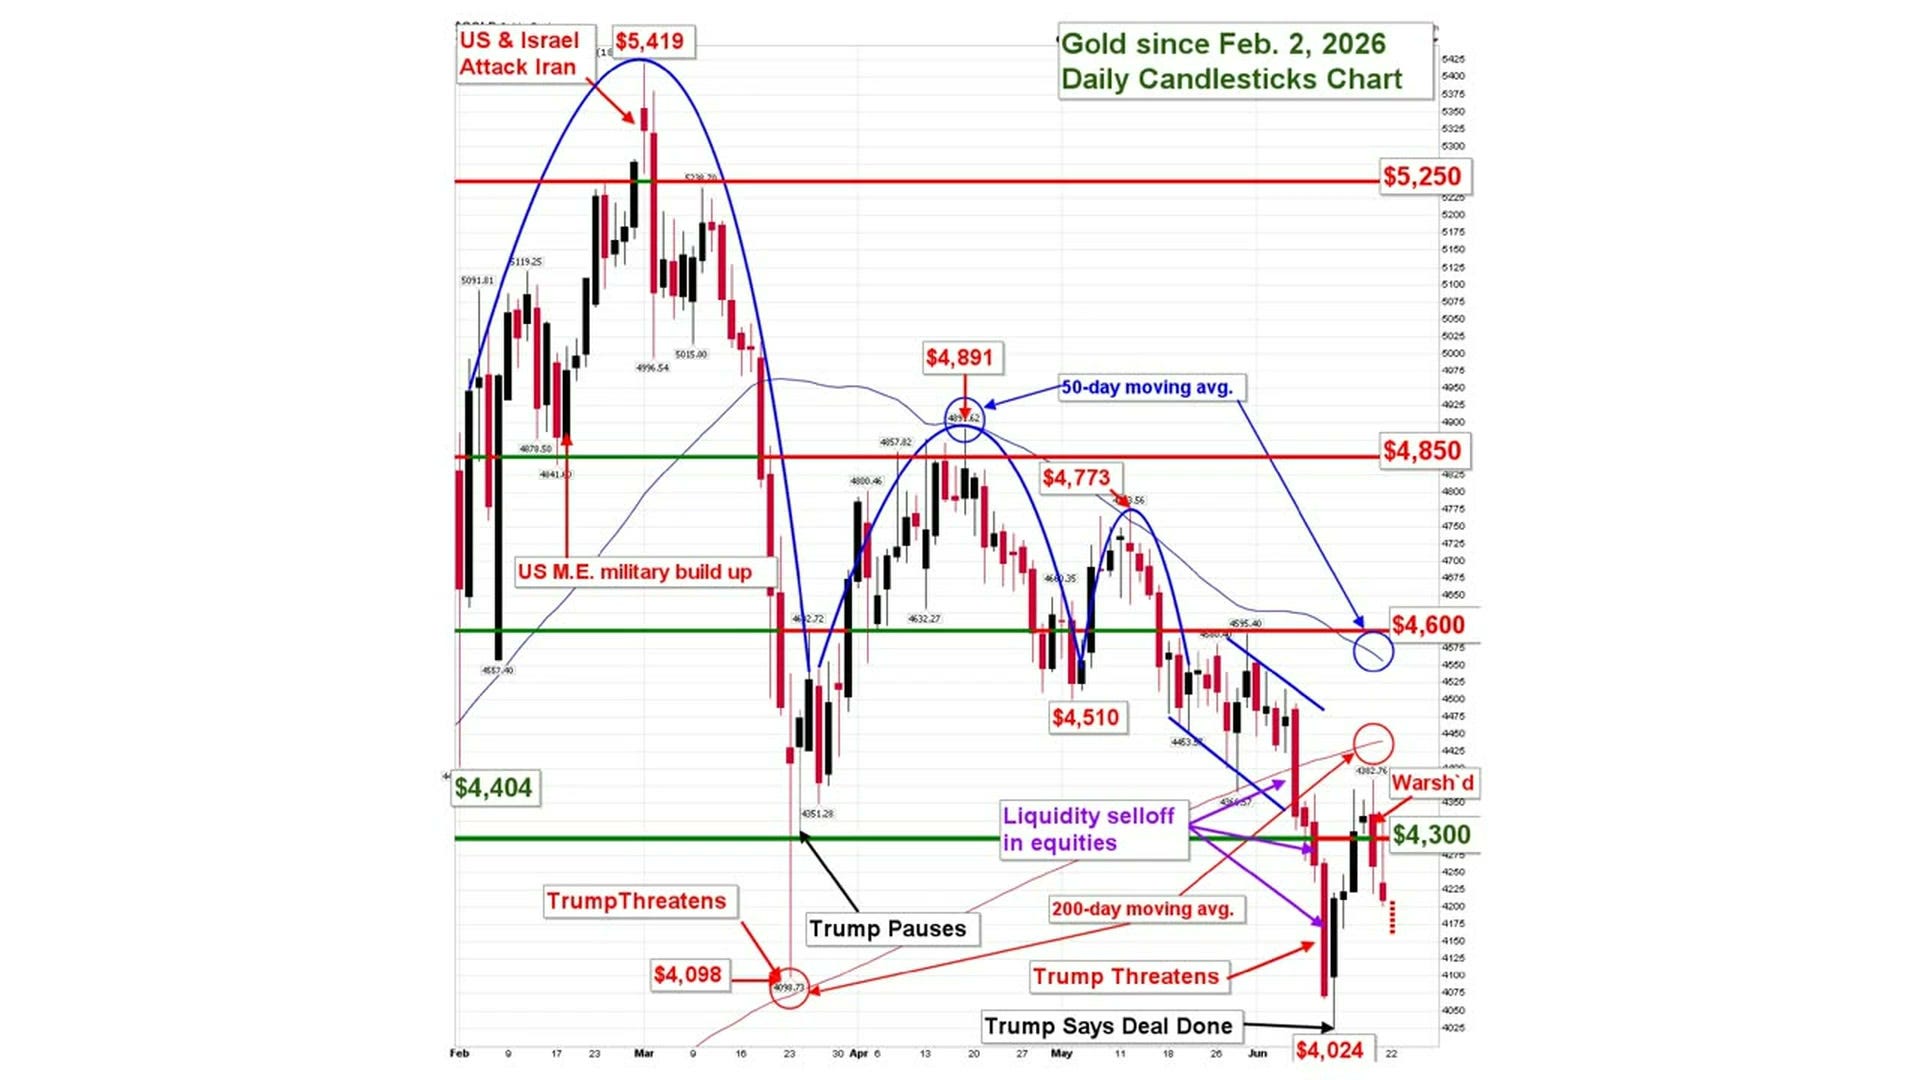
So the violent, war-driven downdraft is giving way to more fundamental price action. But we are still easing lower.
Where the support and resistance levels sit now
Here is where I see the lines drawn today, metal by metal. These are the numbers I am trading against.
Gold. Support at $4,025, where we bounced off that candlestick low. Resistance now at $4,300, which had been major green support on my chart all along. We are violating that level now, which tells me gold is moving into a slightly weaker phase. I think gold tests $4,000 in the coming weeks, and I see us in roughly a $4,000 to $4,300 trading range. The 50-day and 200-day moving averages are both sitting substantially above the market right now, so they are immaterial to the near-term action.
Silver. More constructive than gold. Silver never set a new low the way gold did. It bounced off its prior low right around $61, spiked down to $61 on the liquidity sell-off, and washed back out to $64.90 today. I see silver in a $63 to $70 range, with major support at $61 and the 200-day moving average coming in around $68.10. The bias is a bit to the downside, and I do think we test $61, which is a level I expect will attract significant buying.
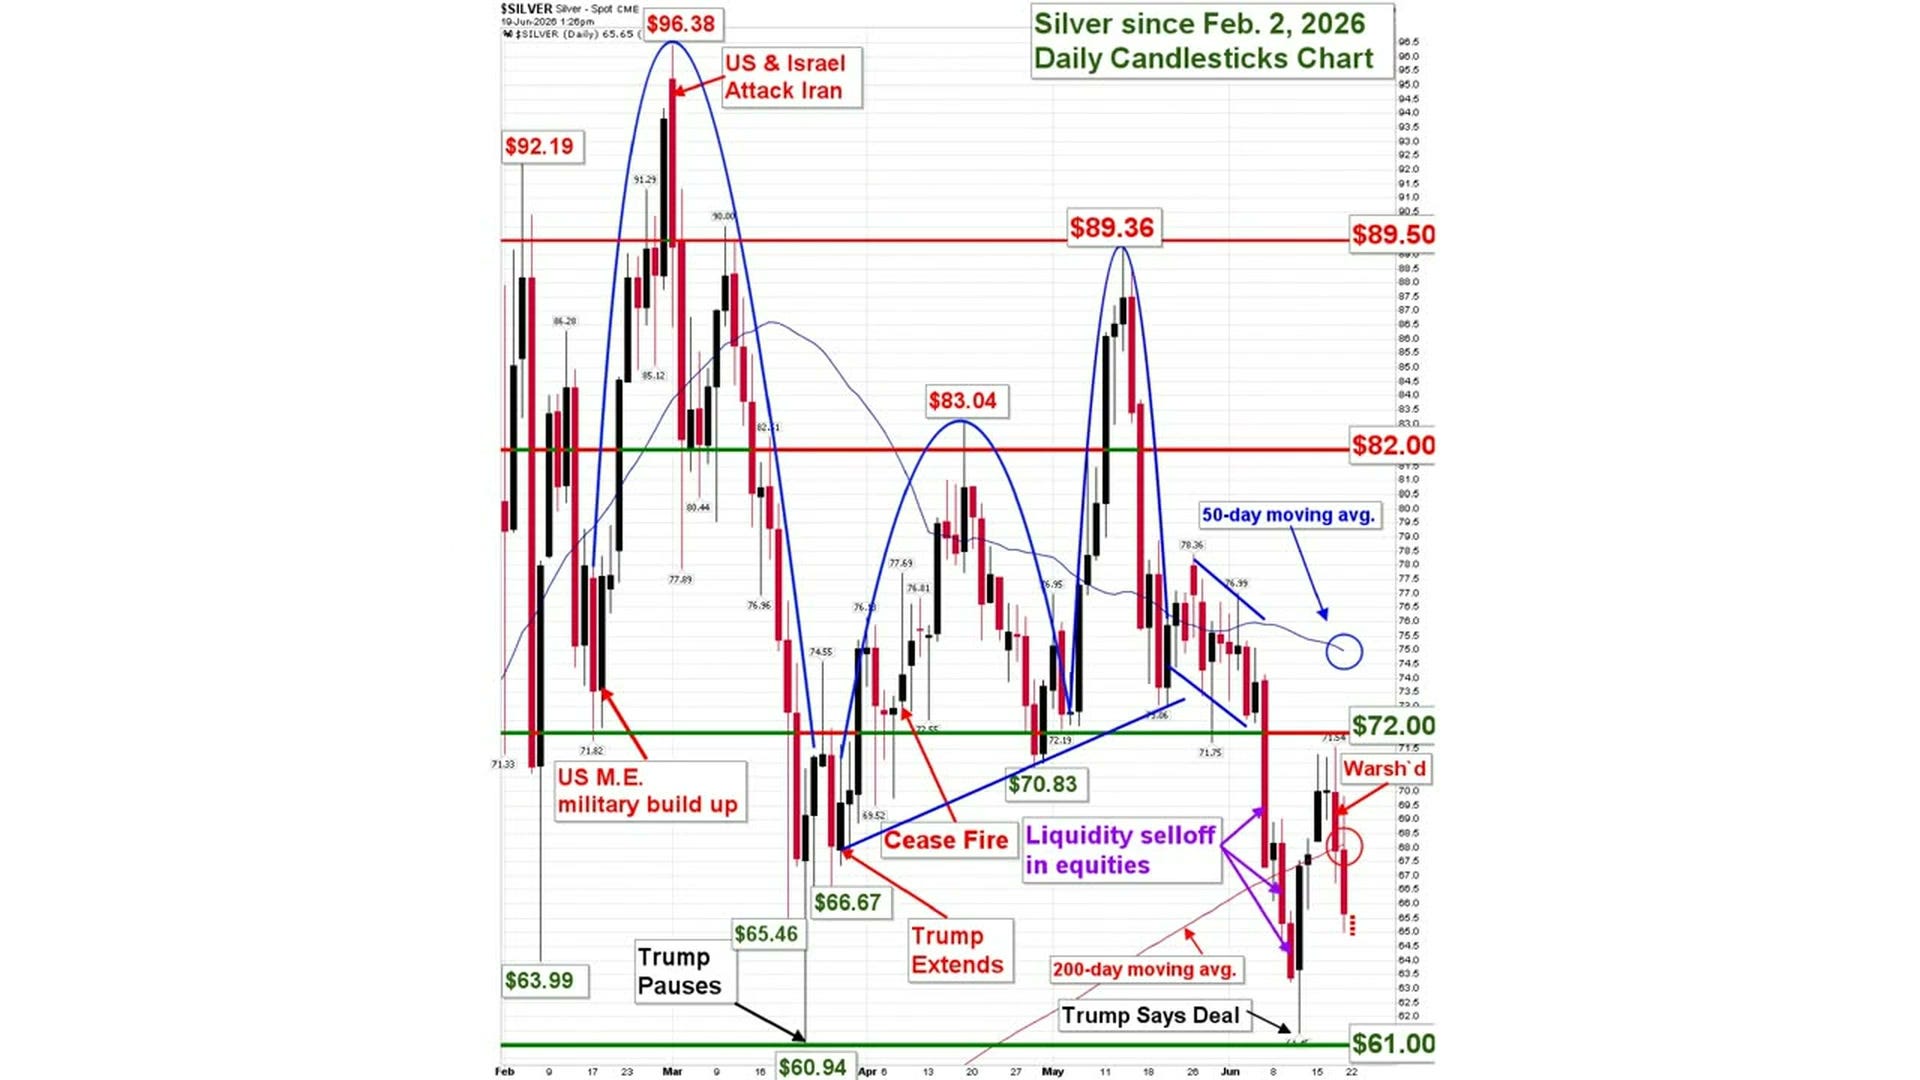
With gold at $4,155 and silver at $64.90, the gold-to-silver ratio sits at about 64 to one. That is neutral territory to me, where both metals are in fair value relative to each other.
Platinum and palladium. Both decidedly weaker. Platinum broke down hard under $1,800, set a new low at $1,662 on the liquidity leg, and is closing today at $1,666, a whisker above that low. Palladium bounced off $1,200, below major support at $1,345, and is at $1,266 today. These are more commodity-driven metals, more sensitive to industry and Asian buying, and that demand has been soft. They look cheap to me, but I think they can go a bit lower still in this environment.
The dominant driver stepping into the vacuum
Now to the part that actually matters for where we go from here.
For most of the past year, gold traded in a direct inverse correlation to the 10-year Treasury yield. As yields rose, gold fell, because gold pays you nothing and a Treasury does. When the yield on a Treasury climbs, it makes that bond look more attractive than gold to a longer-term investor, and that competition weighs on the metal. The 10-year has been holding up above 4.45%, the highest level in years, because inflation concerns remain firm even with oil off its highs.
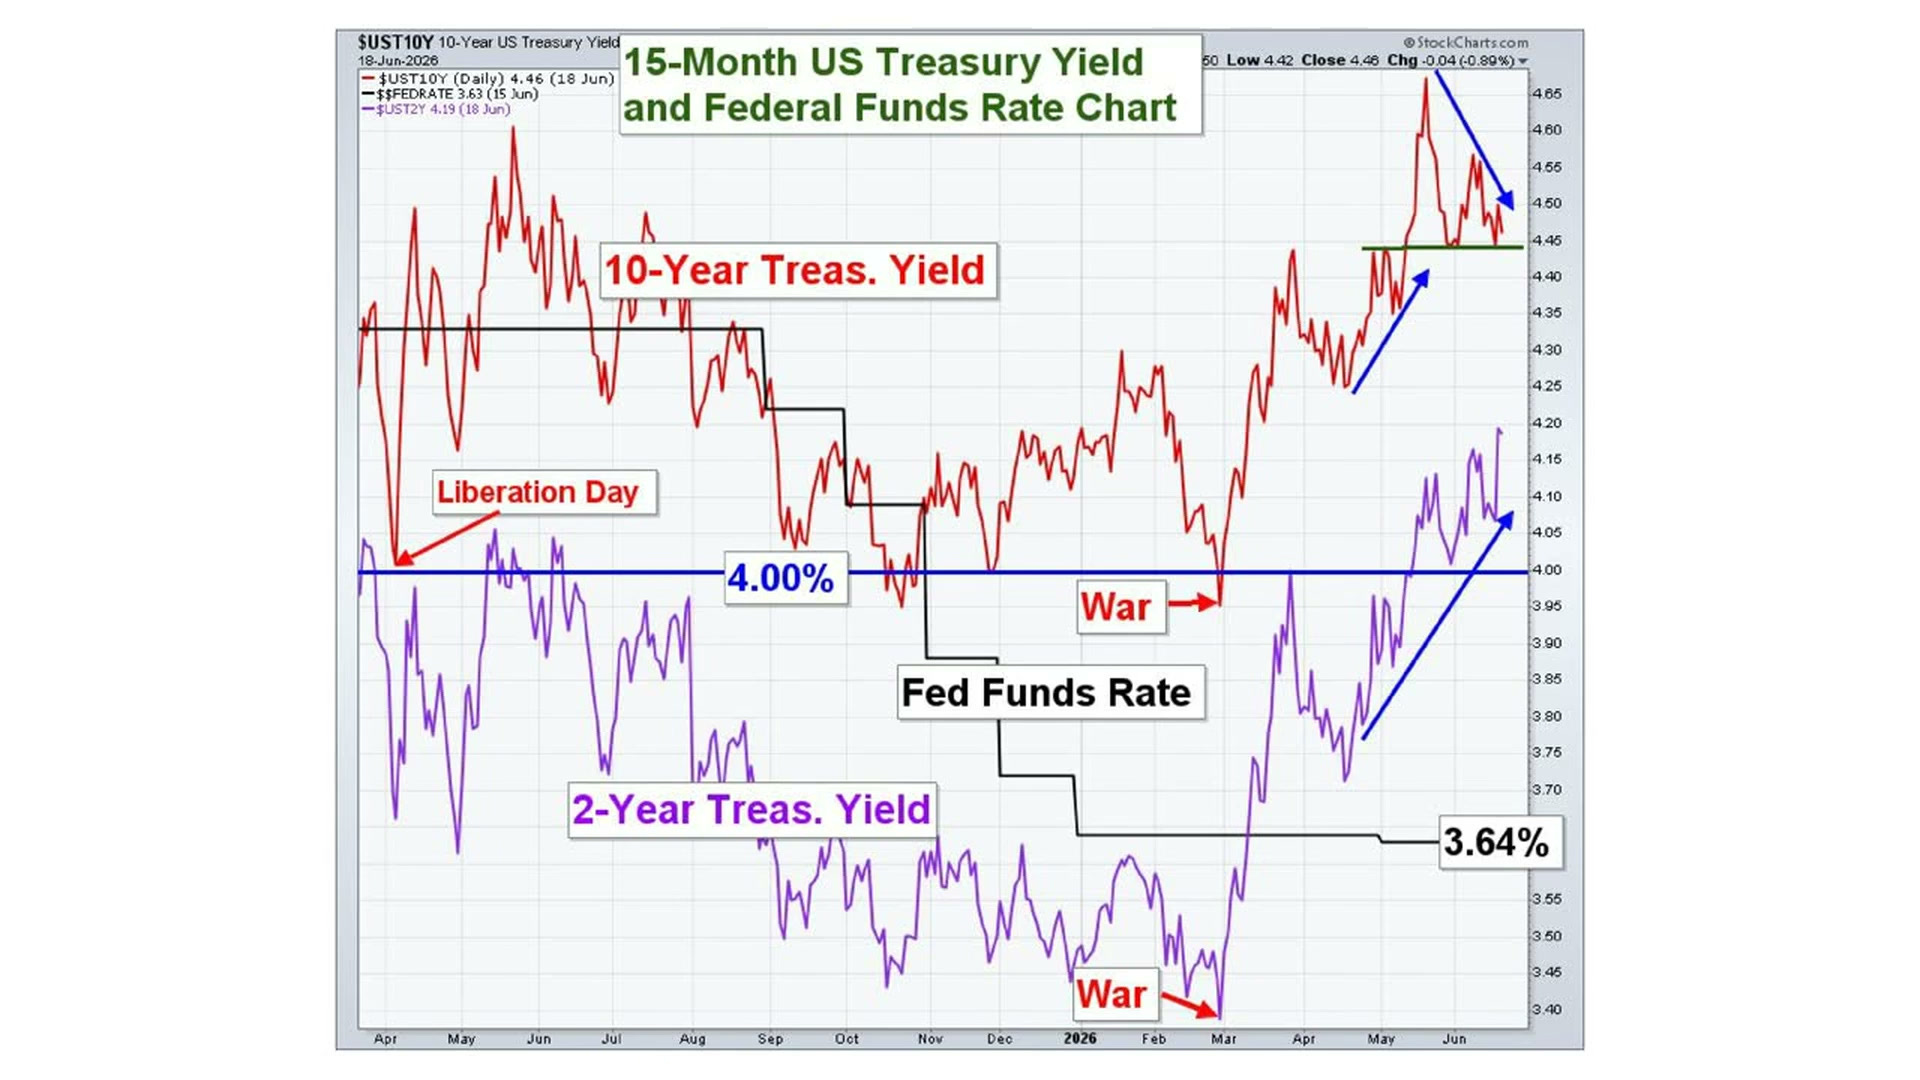
But that direct inverse correlation to yields has broken down over the last few sessions. In its place, a new driver is emerging, and it is the dollar against other currencies.
For this whole past year, the dollar rose up to but repeatedly failed to break 100.50 on the US Dollar Index, with downside support around 96.77. That 100.50 line was the ceiling. Then in the last couple of trading sessions, on the back of the Warsh Fed and the prospect of a hiking cycle, the dollar broke out above 100.50 to its highest level since May 2025. The real question is whether this is a true breakout or a fake-out. If the market expects the Fed to raise rates, this is likely the real thing.
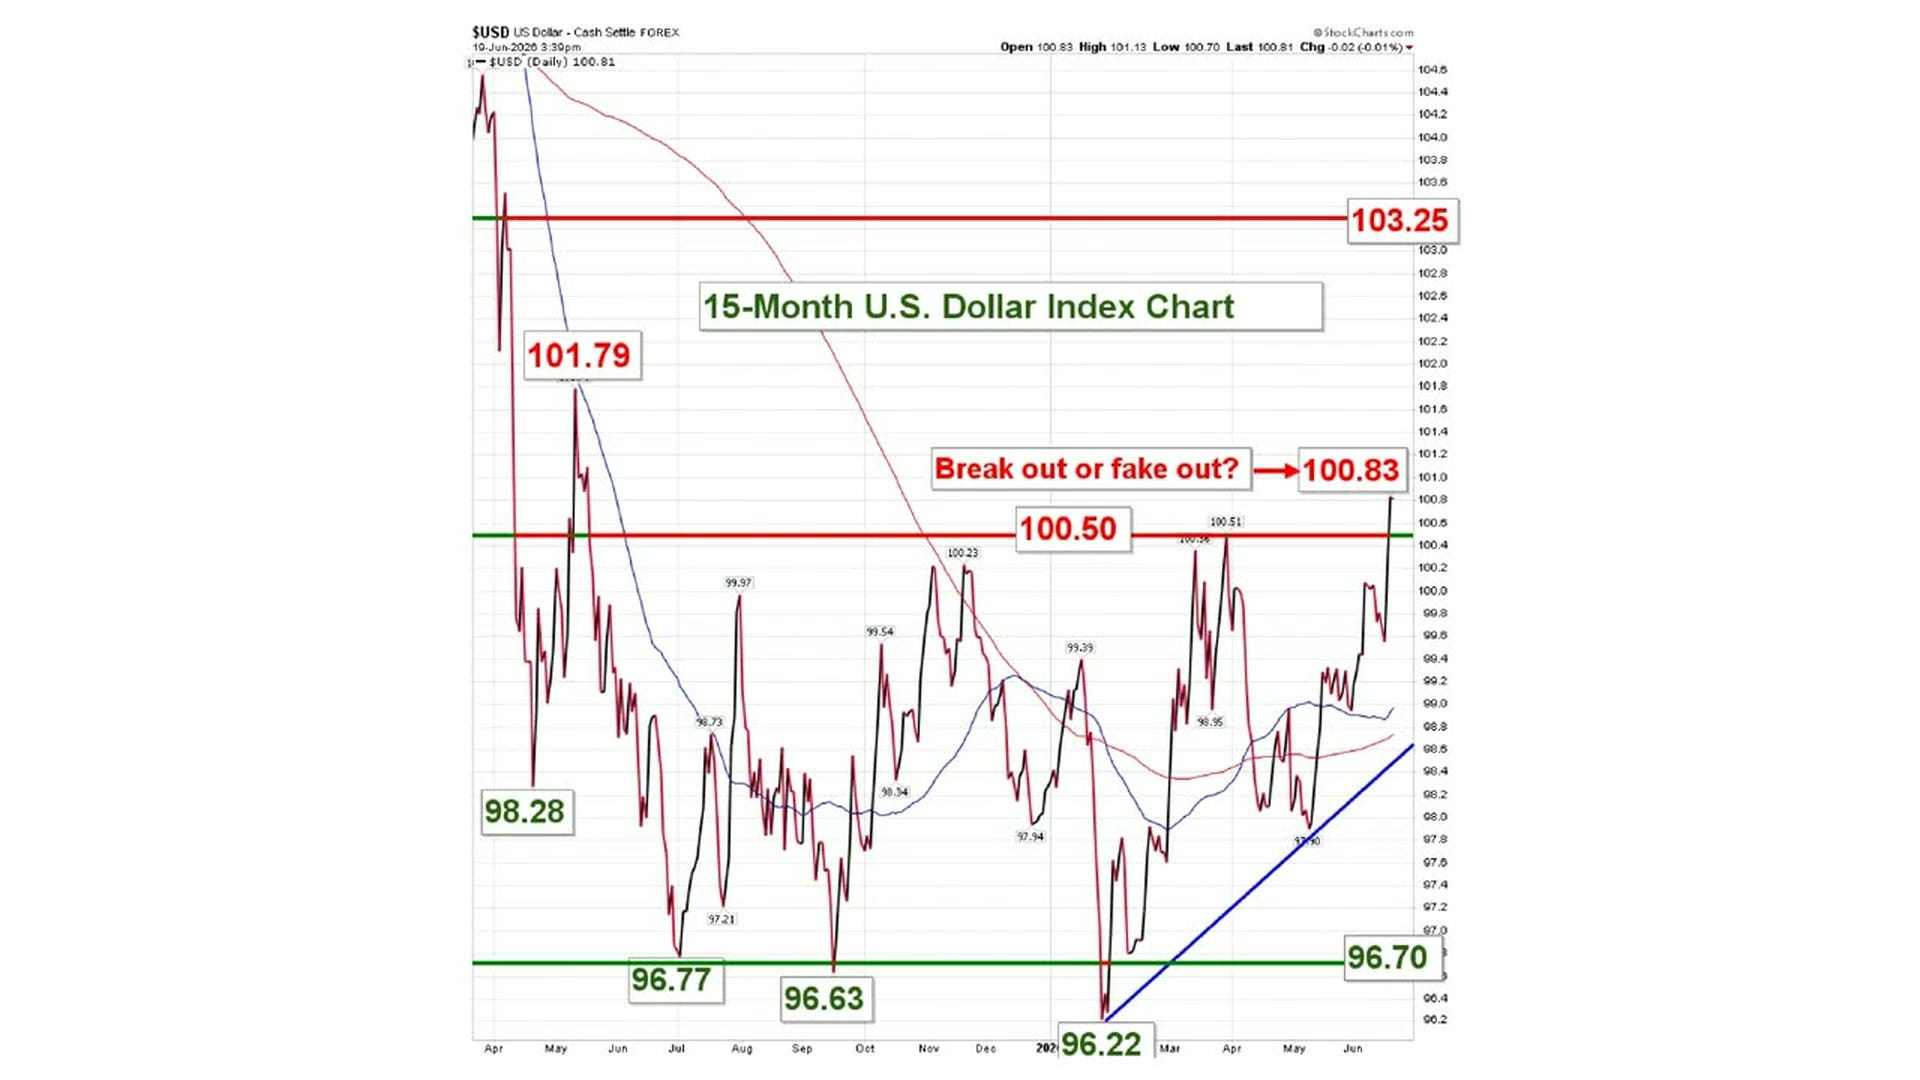
The dollar and gold, like the dollar and yields, are inversely correlated. And we are seeing the dollar strengthen in particular against the yen, which has been challenging 160 and breaking below it. The US economy is stronger than the Japanese and European economies right now, so this dollar breakout may just be getting started. A stronger dollar over the coming weeks and months would in turn pressure precious metals lower. That is the new driver stepping into the vacuum the war left behind.
What the one-year charts say about the summer
Now that we are in a consolidation phase, the longer-term charts come back into play, and this is where I think the summer sets up.
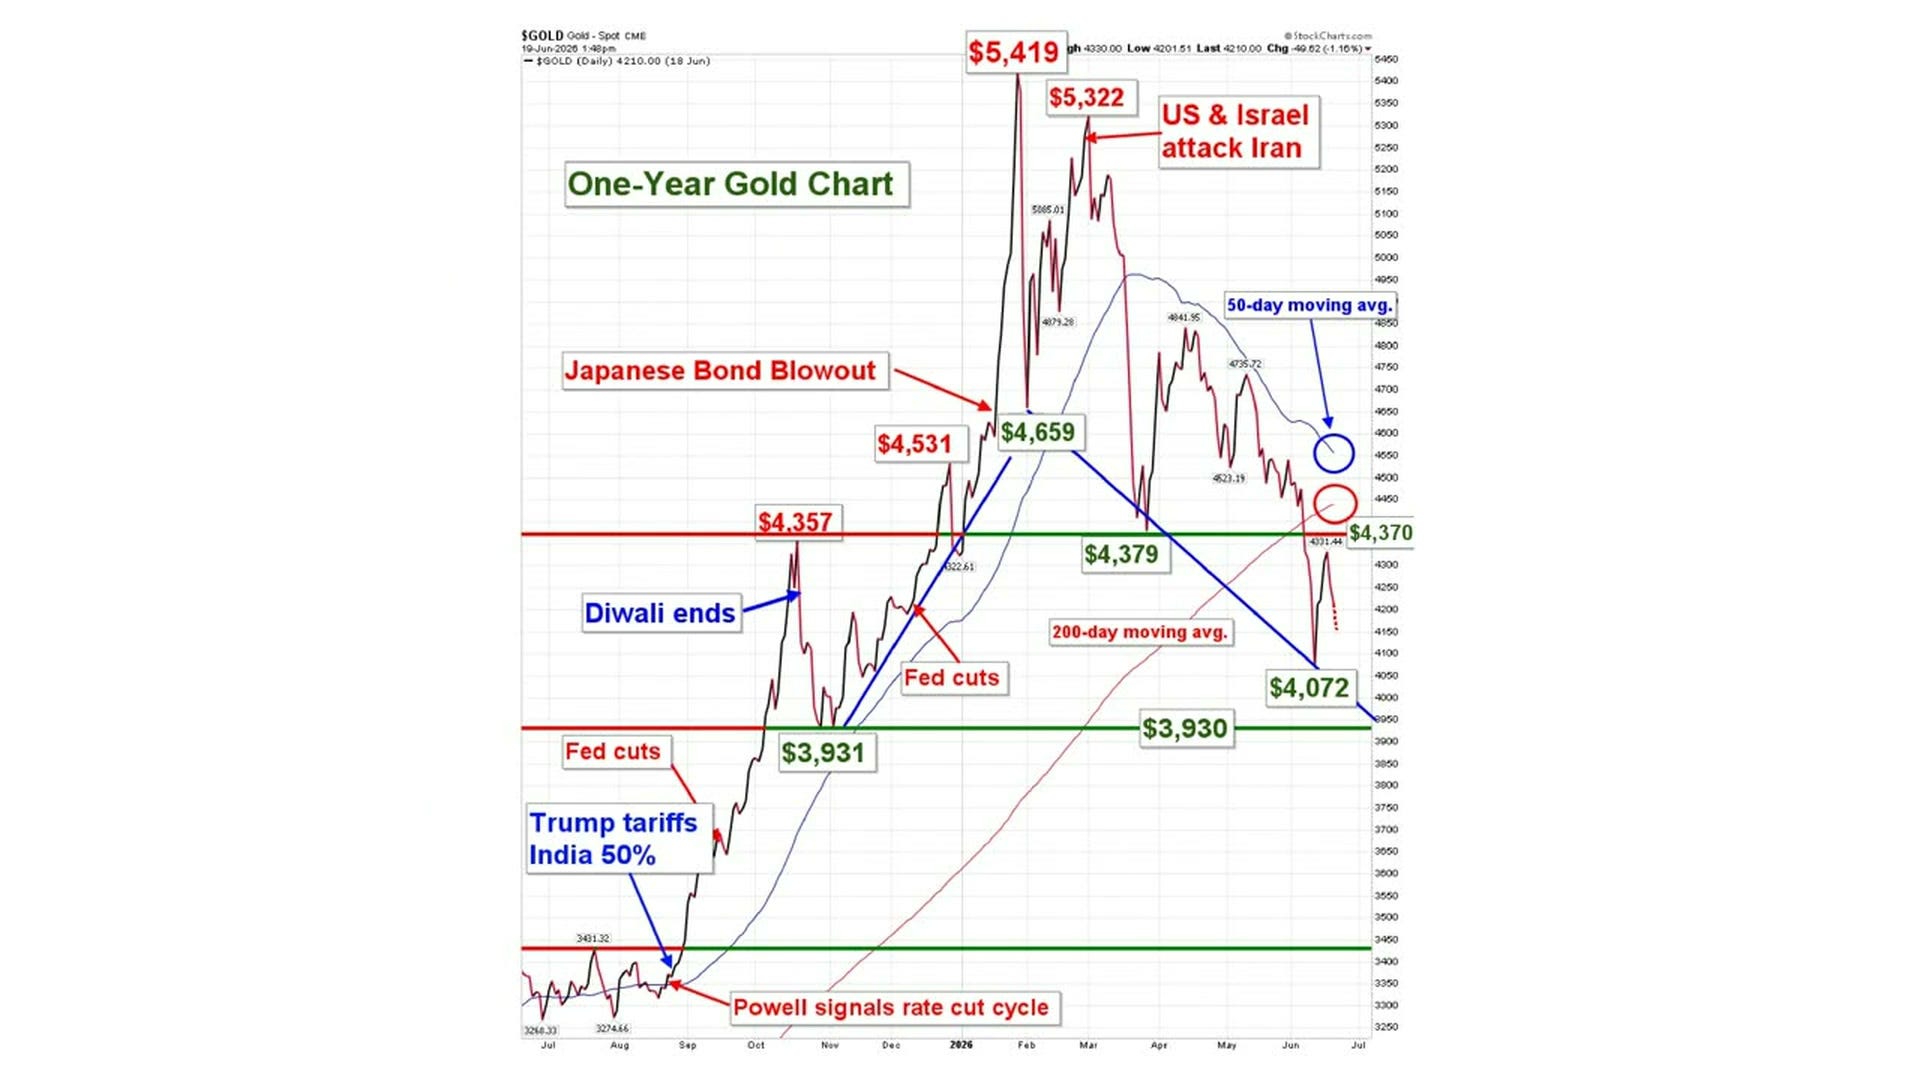
On the one-year gold chart, the most important feature is the descending blue trend line connecting the three lower daily-close lows: $4,659, $4,379, and $4,072. Extend that line and it points to gold just above $3,950. If that trend holds, and I think it will, we see gold test $4,000 and maybe dip a little under it. A three handle on gold, rather than a four handle, is what I think it may take to attract serious buying into this market. We may get exactly that in the coming weeks.
Silver has a similar downward trend line, a bit more defined but more modest, connecting lows at $70.60, $67.60, and $63.40, which points to about $62.50. Here is why I still favor silver of the four. It has better fundamentals moving forward: a structural supply deficit, high industrial usage, lower overall availability, and limited ability to ramp production since so much silver comes out of the ground as a byproduct of other mining. That is why silver’s chart is holding up a bit better than gold’s to the downside. Of the four precious metals right now, silver looks like the strongest, with gold second, and platinum and palladium weaker still.
So all four metals look soft to me heading into the quieter summer months. The fog of war is dissipating, the fundamental drivers are reasserting themselves, and the dollar is the one to watch.
What I would own into this pullback
If gold does print a three handle in the coming weeks, that is not a moment to fear. It is the kind of level that has historically brought serious buyers off the sidelines. For clients looking at that setup, this is where I like the vintage US gold coins. An MS64 $20 Saint-Gaudens trading near the same premium as bullion eagles gives you the gold exposure plus real premium-expansion potential over its long-run average, which is a second way to win if you are patient. If we can help you position for the summer in physical metal, whether bullion or numismatics, we would be honored to have that opportunity.
This is our 28th year in business, and it is the loyalty and trust our clients place in us that makes that possible. Without you, we would not have a business, and we are grateful for that every day. We are grateful, too, for a little peace in the Middle East, and hopeful it holds.
Good luck out there, and I hope you are enjoying your summer.